The North American Butterfly Association (NABA) manages three independent monitoring programs. This includes the Seasonal Count Program, the largest volunteer-based butterfly monitoring program in existence, covering all the US, parts of Canada, and even some limited sites in Mexico. It is also the program with standardized survey protocols that has been running the longest (even compared to the UK!). The program was started by the Xerces Society in 1975, and patterned after the Audubon Society's Christmas Bird Counts. It was taken over by NABA in 1992 where it grew rapidly. Now, each year around 450-500 circles with a diameter of 25km are surveyed by groups of volunteers and all butterflies observed within a single day are counted. Traditionally, count circles were surveyed once per year, but in 2009, groups were encouraged to survey once in spring, summer, and fall. That is why the program, formerly known as the July 4th counts, is now known as the Seasonal Counts. Most of the information on this page refers to the Seasonal Count Program, but we also include information on NABA's other two monitoring programs: their Sightings Database (initiated in 2001) and Butterflies I've Seen, a platform to manage personal sightings records (initiated in 1998)
North American Butterfly Association
Monitoring Activity Tracker
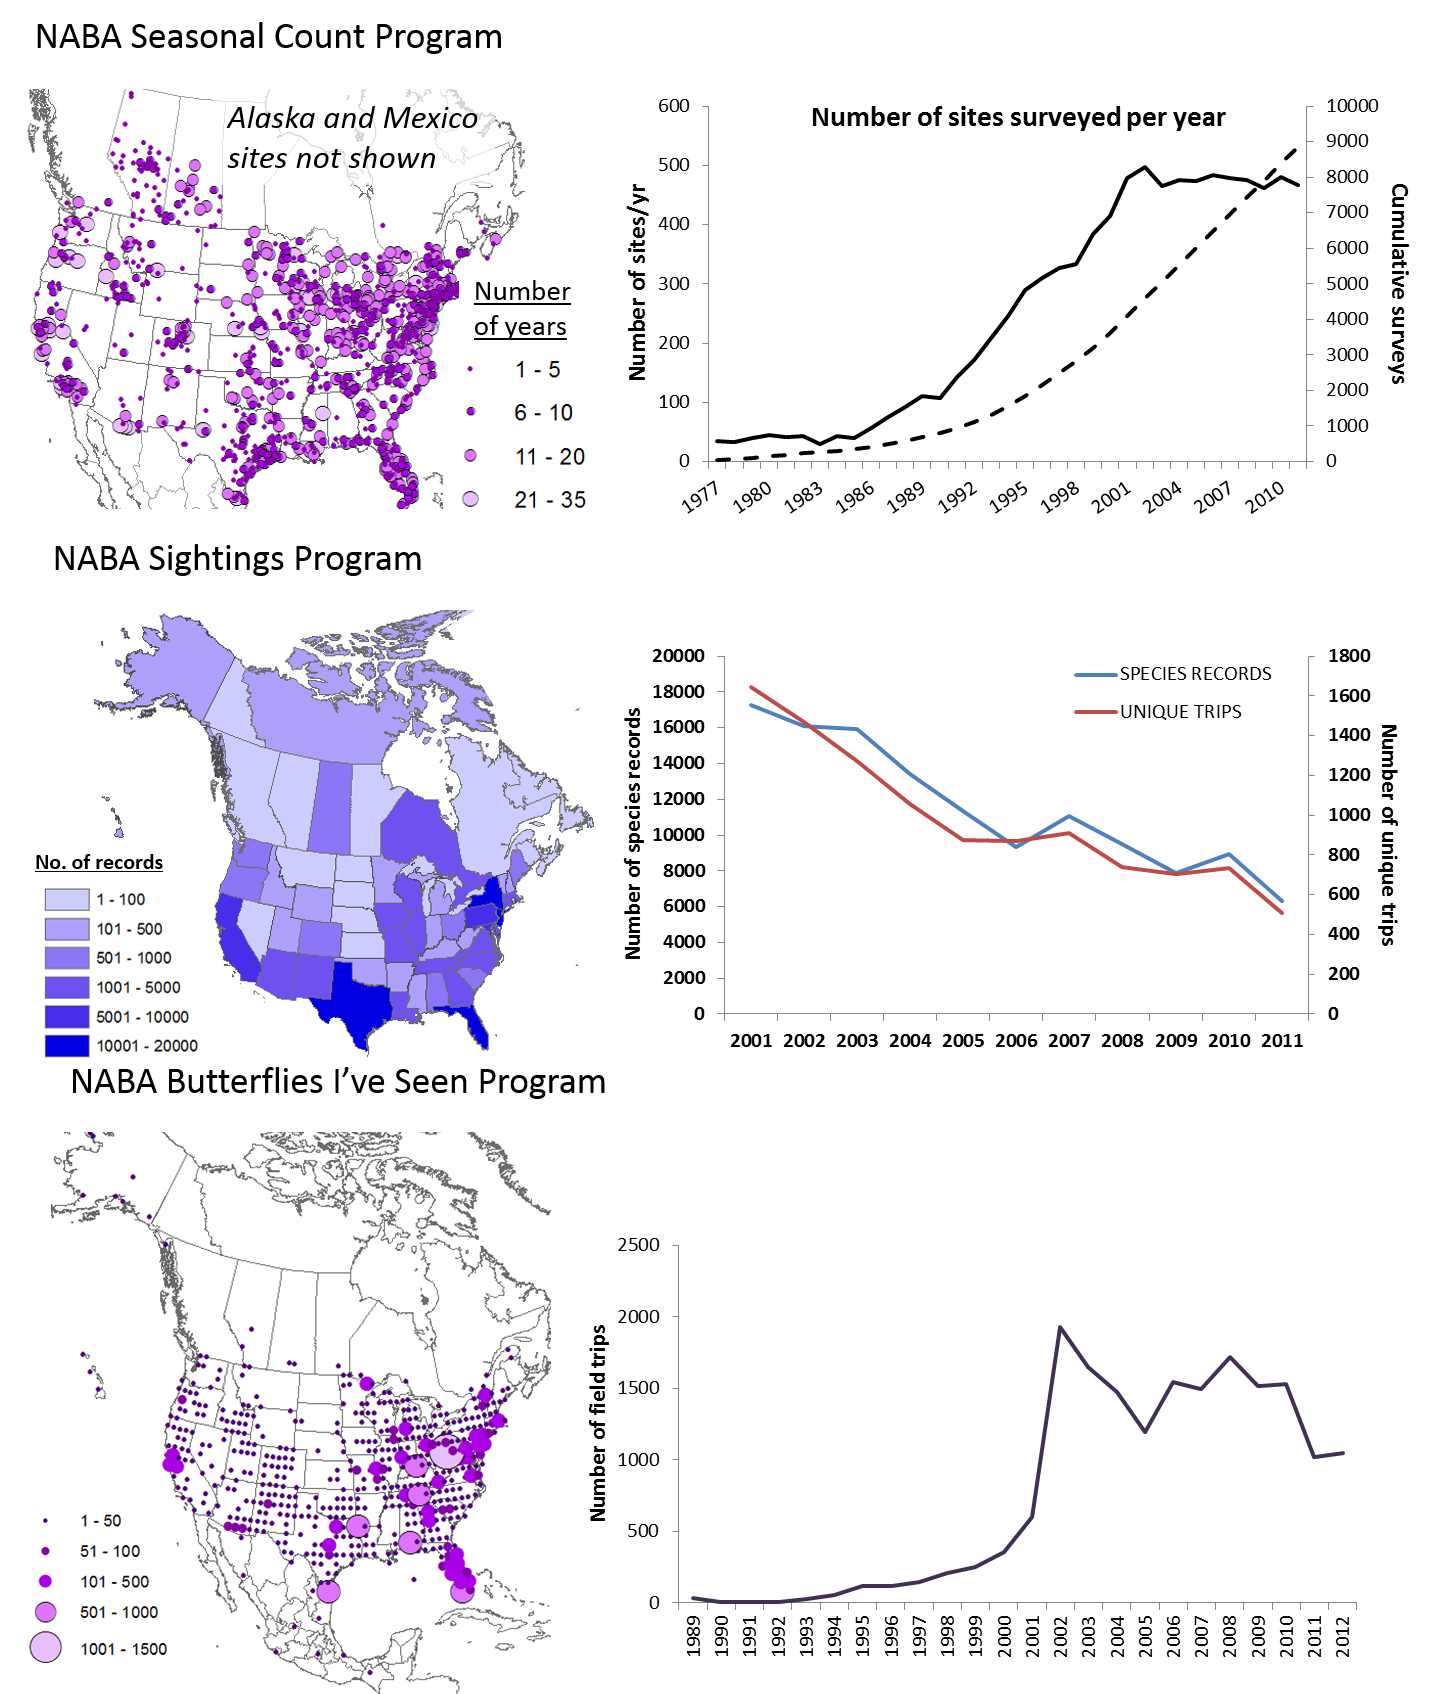
Snapshot
Sightings Program
Butterflies I've Seen
WeButterfly - Butterfly Information and Data Visualization Platform
Protocol
Program Results
 Meehan, T. D., J. Glassberg, and C. Gratton. 2013. Butterfly community structure and landscape composition in agricultural landscapes of the central United States. Journal of Insect Conservation 17:411-419. This study shows the impact of different land-use practices on butterfly communities in the agriculturally-intensive Midwest. The authors used 66 NABA count sites to examine patterns of richness during 2008 and 2009. Landscape-level butterfly species richness (based on rarefaction estimates) was highest in agricultural landscapes with relatively low amounts of cropland, relatively high amounts of woodland, and intermediate amounts of grassland and wetland. This is shown on the top figure on the right (a) which displays the results of an ordination that relate species richness and butterfly community structure to different landscape configurations. Each point represents a count circle, and points closer to each other in ordination space have more similar communities. The size of the circle indicates species richness. The arrows show how the position is related to habitat cover. Unlike other land cover types, urban development had a consistent negative effect on rarefied richness. Butterfly community structure (based on relative abundance) was also significantly related to the amount of cropland, woodland, grassland, and wetland in the landscape. The bottom figure (b) shows how different species drive community patterns (the location of the species name relates to its dominance in the communities represented in the top graph. The rarest butterfly species (in grey) were associated with woodland-, grassland-, and wetland-dominated landscapes, likely due to their association with plant species occurring in savannahs, prairies, and marshes, respectively. Assuming that variation across space reflects changes over time, these results support conclusions from previous studies that removal of natural and seminatural habitats alters butterfly community structure and decreases species diversity in agricultural landscapes.